Real Time Live Data Plotting in Matplotlib Using FuncAnimation() and Python for Beginners
by xanthium-enterprises in Circuits > Computers
161 Views, 2 Favorites, 0 Comments
Real Time Live Data Plotting in Matplotlib Using FuncAnimation() and Python for Beginners
In this Instructables ,You will learn how to plot real-time data coming from a sensor or network on a Animated Matplotlib graph using the built in FuncAnimation() function and Python.
Here we will focus on how to create and configure the FuncAnimation() function in the Matplotlib library for animating our own real time line plots ,which you can use to display continuously updating values like sensor readings, stock market prices etc.
We also have a video version of the Instructable below, Do Check it out
The instructable is designed for a beginner who is new to Matplotlib Plot Animation functions and wants to visualize the data coming from an Arduino or Data Acquisition system.
Here focus will be on the Matplotlib line plot animation part.
You can find the original article for Matplotlib line plot Animation along with Source codes below.
The above article also covers the fundamentals of Matplotlib charts.
Example code for Scrolling Matplotlib Animated Line Plot can be found on GitHub.
Supplies
Software only Project, Not much needed. Everything you want can be freely downloaded from the internet.
- PC (Windows/Linux) or Mac OS
- Matplotlib Library
- Python Interpreter
Source codes for Real Time Data Plotting using Matplotlib and Python
- All the source codes can be downloaded from our website or Github Repo.
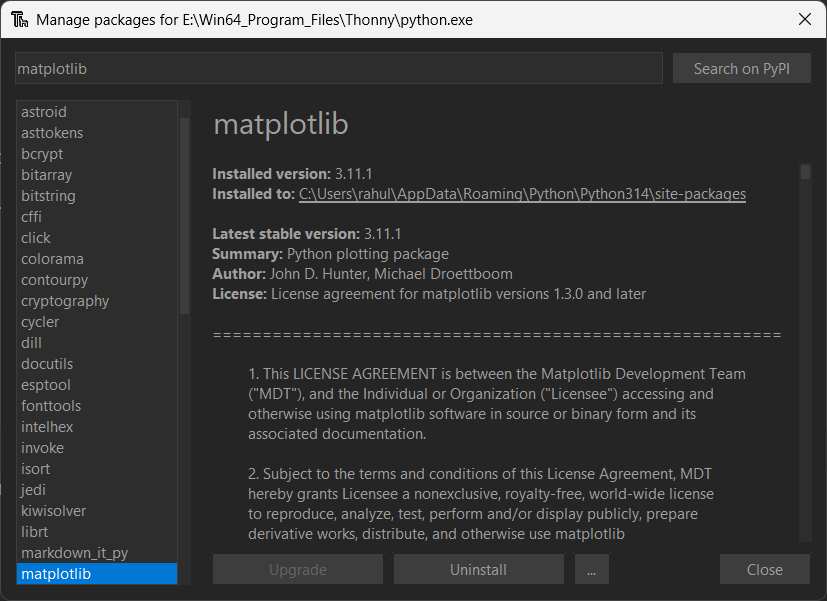
Installing Matplotlib
You can install matplotlib library on your Python installation using the pip command
 alt="installing matplotlib on windows11 using pip"
On Linux OS ,You may need to create a Python Virtual Environment (VENV) before doing this.
If you are new Python virtual environments .Here is a
Easiest Installation Method
You can use an IDE like Thonny and install it from its repo directly too.This will be much easier for beginners as it has few hassles compared to others.
Pycharm IDE
You can also use the Pycharm IDE for developing the Matplotlib line chart tutorial.
Here is a Brief Tutorial on setting up Matplotlib Library with PyCharm IDE for Beginners
Creating a Simple Line Plot Animation Using Matplotlib FuncAnimation() Class
Here we are going to create a simple animated moving line port using the Matplotlib's FuncAnimation() class and Python.
Our focus here will be on the animation side of the Matplotlib ,so we will using a set of random values to display our y values.
The code for creating simple line plot animation using Matplotlib's FuncAnimation() class is shown below.
First We,
import the FuncAnimation() class from the matplotlib.animation module.
then we create two empty Lists to store the x and y coordinates
we then create figure and axes as usual using the subplots() function.
compared to a usual matplotlib plot, We do not give the list values to the plot() function.
We provide them with empty lists and no data.
The .plot() returns a Line2D object (here line,) which we later use to draw the lines between points.
We then enable the Grid and set limits for our graph.
After which we define the update() function, which constantly update the graph and draw the lines on the plot and return the line object.
Finally we define the ani = FuncAnimation() which calls the update() function periodically.
and finally the plt.show() function which displays the Figure on the screen and start the FuncAnimation() event loop.
We will discuss how the FuncAnimation() function works in details below.
Understanding the Workings of FuncAnimation() Class in Matplotlib
FuncAnimation() is a class from Matplotlib used to create animations by repeatedly updating a plot.It is mainly used when you want something on a graph to change over time,for example, a moving point, changing sine wave, bar chart animation, etc.
Here we will learn how the FuncAnimation() class works and how you can use the FuncAnimation() class to create a moving animated real time plot using Python.
Now we will learn about the main parameters of the FuncAnimation() class and how they are used to create animated plot.
figure - >is the first parameter that identifies the figure to which the plot belongs
update -> Name of the function that is being called by FuncAnimation() after a specific interval of time has elapsed.
update is just the name ,you can also use other names like func or my_update
frames = 20 -> here frames define the number of times that the FuncAnimation() will call the update function. Here frames = 20 ,so FuncAnimation() will call the update() function 20 times, starting from 0 to 19.
After reaching 19 the FuncAnimation will stop calling update() function and the plot stops updating
interval =1000 ->here interval is the time interval between calling each update function.It is defined in milli seconds ,so here 1000 so 1 seconds.
blit = True -> This means that the plot will redraw only those parts that have changed. This helps to reduce the load on the CPU and makes the animations more responsive and jitter free.
repeat = False ,this means that the plot animation will stop after the number of frames have reached 19 (0-19 steps).If it is not True,the animation will keep repeating again and again.
How FuncAnimation() Class in Matplotlib animates a Plot

Here we will learn how the FuncAnimation() class animates a Matplotlib chart using Python.
Once you start the code and reaches the
the .show() function will display the figure on the screen and start the GUI event loop.
FuncAnimation() will call the update function every 1 second as the interval is 1000ms which is equal to 1 second.
On the First call ,it will pass frame =0 to the update function ,
so update(0) which then passed on to
where we append the frame =0 to list x ( x.append(0) ),
and we create a random integer value between 1 and 10 and upend to the Y List
Now x =0 and Y= lets say 4
these values are used to draw a line using line.set_data(x, y)
after which the update () function returns a Line object which the FuncAnimation() class uses to identify the parts of the graph that had changed.
This is because we have set blit =True, so only changed sections are redrawn.
After 1 second had passed, FuncAnimation() will call update() again and pass the value frame =1,so update(1)
Now x=1 and y=another random value, lets say 3
Another line is drawn between the new coordinates.
After frame=19 ,the animation stops .
Building a Side Scrolling Animated Line Plot With Matplotlib
In the previous example, we learned about the basics of animating a line plot using Matplotlib and Python and how the FuncAnimation() class works.
The last example had an important issue that the animation was limited to a select number of frames. We used frames = 20 to limit the plotting to 20 points ,If you are planning to plot a real world graph, you may want to animate more than 20 frames.
Here we will learn to create a scrolling chart (plot) that slowly scrolls to the side like a chart recorder or an ECG chart and will have unlimited frames. To achieve these we will have to make certain modifications to the original python program.
Deque instead of Lists
First difference is in the way Lists are used ,in long scrolling animations it is quite unwise to use the traditional lists. As the program runs for a long time the List grows longer too ,wasting memory and resources.
so for long running scrolling animations ,instead of a traditional list[] we should use a deque with a fixed width.
As the number of data entries in the deque reaches above the maximum size (maxlen) ,the older values are discarded as the new ones are uploaded as shown below.
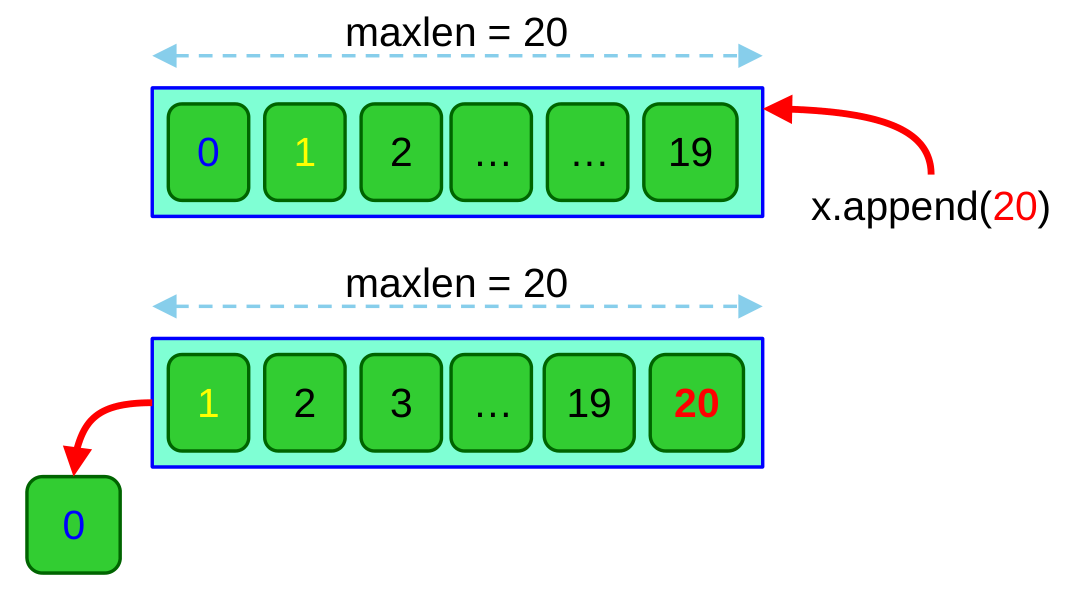
Now here x can contain up to 20 values ,as maxlen = 20,once the 21st item is upended to the deque x ,the first value is discarded.
FuncAnimation() differences
Here we will learn how to configure the FuncAnimation() class to create continuous long running plots instead of fixed number of frames.
In the previous example we provided the number of frames that the plot have to run ,in the case of getting data from an Arduino or external source we cannot predict the number of frames before hand.
We also find the ticks or numbers on the x axis of the Matplotlib move as the graph advances in time
So we make a few changes to the FuncAnimation() class parameters as shown below
It is mostly similar to the previous one except the following parameters.
As you can see here parameter
- frames = None
that means that Matplotlib will generate endless frames until the window is closed by the user.It will start from 0,1,2,.......till window is closed.
Here you can see that blitting is disabled as blit =False.
This means that Matplotlib will redraw every thing including X and Y axis ,text on the graph,plot lines and such.
This is computationally expensive but a necessity to display a side scrolling matplotlib plot.
If blit =True .
The plot lines will be displayed and drawn but the ticks on the x axis will remain static and the graph will look static instead of scrolling.
Also
there is no point in caching anything in the memory as we will be redrawing everything from scratch during every update.
Please note that Full Example code for Scrolling Matplotlib Animated Line Plot can be found on GitHub.
Implementing Scrolling Chart Effect on Matplotlib Animated Plots
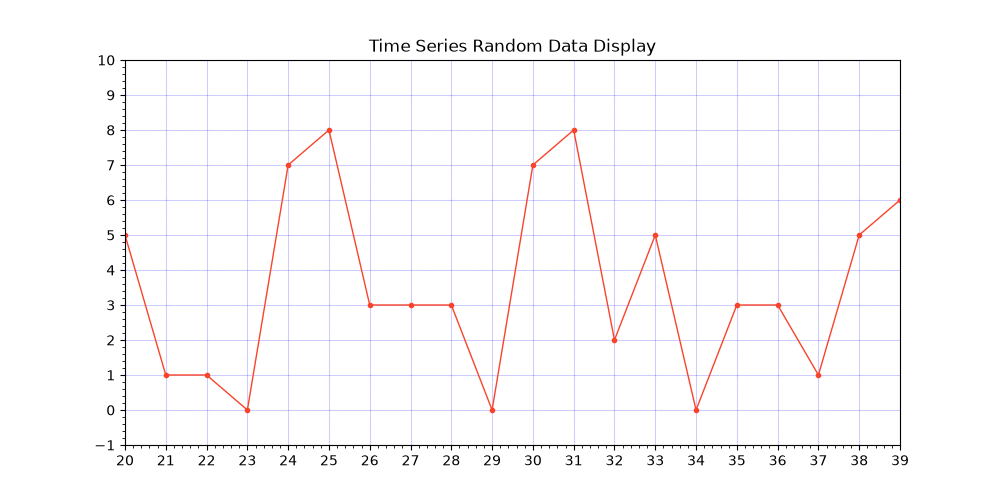
Here we will discuss how to implement the side scrolling chart effect on your animated Matplotlib plots where your plot line advances to the right side in time and the background gridlines and the x axis moves towards the left creating an Strip chart recorder effect or like an ECG or EEG plot.
The side Scrolling action is implemented in the update() method of our FuncAnimation() class.
Here we are constantly changing the limits of the values on the X axis after certain criteria's are met to create an illusion of side scrolling display effect.
the main logic resides in this section
The code checks whether the frame value is greater than or equal to WINDOW_SIZE, Here WINDOW_SIZE is the number of points we want to display at a time.
In our code WINDOW_SIZE = 20,
So as the frame < 20,
else: statement runs and the axes limits remain the same from 0-20 on the x axis.No changes in the limits or in the position of the ticks on the x axis.
when frame >= WINDOW_SIZE (20),
The program changes the limits on the x axis using below formula
- so for frame 20 , axes.set_xlim (20-20+1, 20), So now limits become axes.set_xlim (1, 20),
- so for frame 21 , axes.set_xlim (21-20+1, 21), So now limits become axes.set_xlim (2, 21),
- so for frame 22 , axes.set_xlim (22-20+1, 21), So now limits become axes.set_xlim (3, 22),
As you can see that the code is dynamically changing the limits of the X axis ,
So for Frame 20 ,(1------------------20)
So for Frame 21 ,(2------------------21)
So for Frame 22 ,(3------------------22)
So this creates an illusion that the the ticks are moving to the left while the plot line advances to the right.
thus creating a side scrolling animated matplotlib plot.